October 26, 2022
Ever-increasing competition for each user challenges streaming platforms, broadcasters and operators to strive for the highest achievable video quality on all types of devices. To meet this goal many of them use various quality control systems based on objective metrics. PSNR, SSIM, and VMAF proved to be most widely used and in-demand metrics as shown by rich communication experience with clients in the video quality control filed.
Video streams undergo many stages of transcoding on their way from the copyright holder to the end viewer (Figure 1). Each stage of compression results in data loss and lower quality, while the ongoing struggle to achieve low bitrates leads to the appearance of unwanted compression artifacts. Therefore, video quality control tools are widely used to minimize these negative impacts.
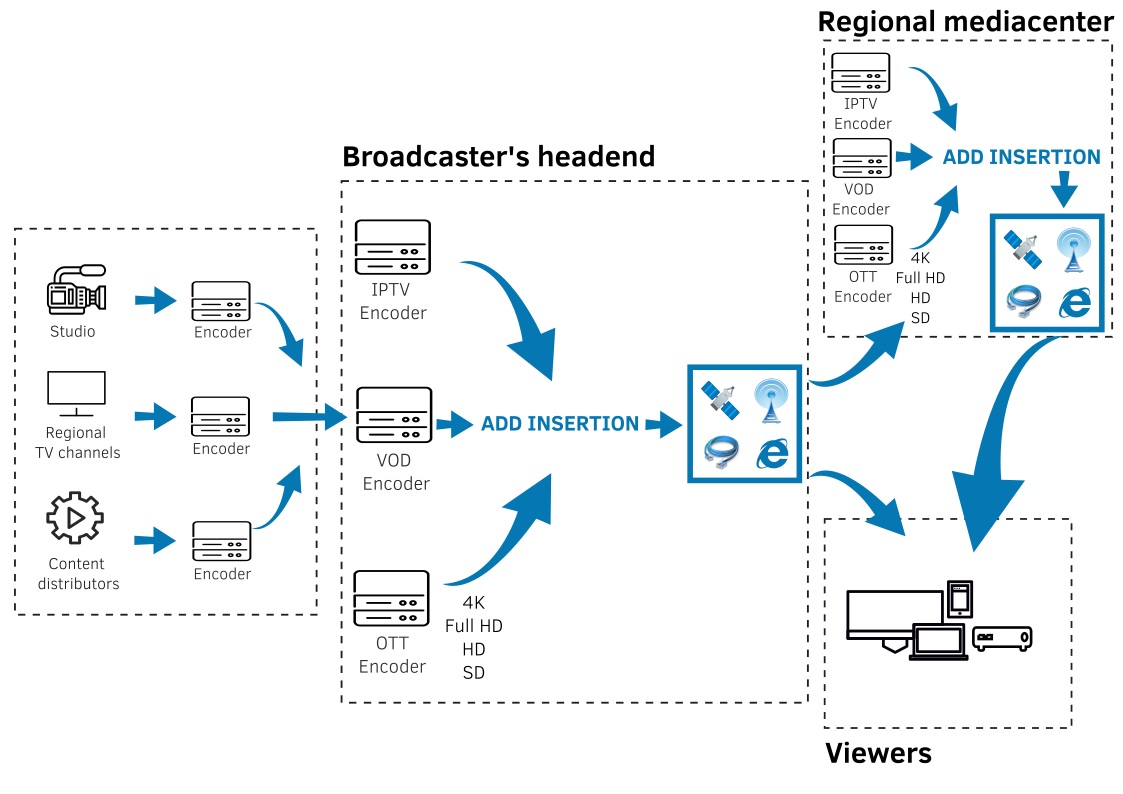
Figure 1. Stream path from the source to viewers
Typically, metrics are used to compare encoders/transcoders, select optimal transcoding settings or provide monitoring of the broadcasted stream quality. Any objective metric is based on calculation of the quantitative difference between the encoded and reference video sequences. In other words, the resulting value reflects only a quantitative difference from the source video without evaluating the subjective video quality perceived by a viewer. It provides objectivity, however, it makes the results’ interpretation more challenging and complicated. This article presents a qualitative interpretation of the quantitative values of the metrics.
Methodology
Test Configurations
A subjective quality test was carried out to define the qualitative ranges of metric values. The test was based on the dual stimulus impairment scale (DSIS) [1]. Respondents were shown video pairs: a reference video image and a test video image. Each pair was demonstrated twice, and after that the respondents were asked to evaluate the second video image as compared to the first one, without knowing the metric values of the demonstrated videos. The duration of a session did not exceed 30 minutes. The algorithm of the evaluation test is shown in Figure 2.
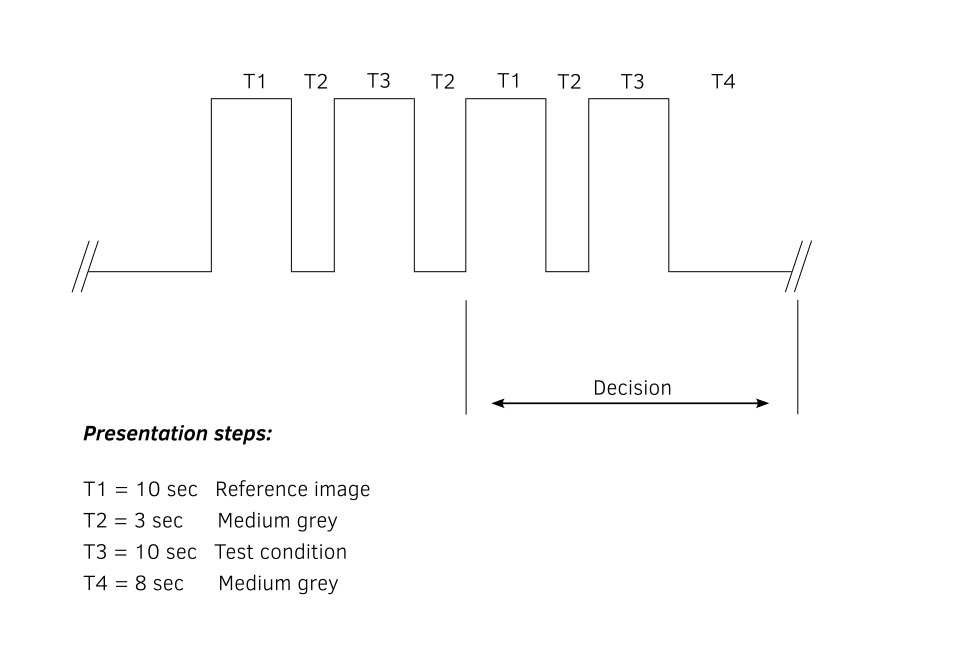
Figure 2. Dual Stimulus with Impairment Scale (DSIS) Method
Subjective ratings were based on a five-point impairment scale with respondents’ opinions mapped to the values 1 to 5, where 5 means impairments are imperceptible, 4 - impairments are noticeable, but not annoying, 3 - impairments are slightly annoying, 2 - impairments are annoying, 1 - impairments are very annoying. Then subjective ratings for each test video were averaged into the mean opinion score (MOS). The standard deviation and the confidence interval were also calculated.
Testing Materials
Testing sample included 19 YUV video sequences with 8-bit color depth, 4:2:0 color subsampling, 1920x1080 pixels resolution. Source video files were downloaded from Xiph.org and Ultravideo.fi [2, 3]. The sample included video materials ranging in dynamics level (dynamic, medium-dynamic, static scenes) and complexity of motion (rotational motion, water motion, etc.) (Figure 3).

Figure 3. Sample of YUV video sequences
Each video was compressed using 15 quality settings. To carry out the test a total of 285 AVC/H.264 video sequences were prepared. Video specifications: 8-bit color depth, 4:2:0 color subsampling, 1920x1080 pixels resolution, 25 frames per second frame rate, progressive scan, and 10 s duration. The following metrics were calculated for each video: PSNR, SSIM, VMAF, VQM, Delta, MSAD, MSE, NQI, and APSNR using –Video Quality Estimator tool – a part of Elecard StreamEye Studio [4, 5].
Stimulus Display
A typical 40” Samsung UE40J6200AU TV with 1920x 1080 resolution was used to demonstrate the video sequences. Standard brightness and contrast settings were used. Image improvement functions were intentionally disabled. The minimum distance between TV stand and respondents was 1.7 m.
Respondents
30 Elecard employees participated in the quality test as the respondents. Among those 60% are men, 40% are women. The ratio of untrained observers to experts was 50% to 50%.
Study Results
PSNR — Peak signal-to-noise ratio. PSNR determines the level of compression distortion and includes a mean square error (MSE) calculation. The range of accepted values is 0 to 100. PSNR is expressed as a logarithmic quantity using the decibel scale. The higher the value, the more details remain in a video sequence after compression, and therefore the higher is the quality. PSNR is a well-known simple metric that does not require complex calculations, however, various studies show a low correlation between metric values and physiological human perception [6].
PSNR indicates physically objectively which of the test videos has more details which remained unchanged and less noise. Therefore, PSNR is commonly used to perform tasks related to selection of best working transcoding settings, or optimization and comparison of encoders/transcoders. It is well-suited for quick determination which of the encoders/transcoders provides a higher encoding quality or which set of encoder/transcoder settings provides more details remaining in a video sequence.
| Video quality | PSNR values |
| Excellent | 38 or more |
| Good | 35-38 |
| Fair | 33-35 |
| Poor | 30-33 |
| Bad | 30 or less |
SSIM is a metric for evaluating image quality based on three criteria: luminance, contrast and structure [7]. The possible values range from 0 to 1, where the higher the value, the lower is the image distortion and the higher is the quality. Compared to PSNR, SSIM requires more computing resources.
SSIM is one of the first successful metrics that most closely matches the human perception of an image, which is confirmed by various research tests. Therefore, SSIM is used for evaluation of perceived quality, for example, for verifying that streaming video quality is satisfactory, etc. SSIM is also used in addition to PSNR.
| Video quality | SSIM value |
| Excellent | 0,93 or more |
| Good | 0,88-0,93 |
| Fair | 0,84-0,88 |
| Poor | 0,78-0,84 |
| Bad | 0,78 or less |
VMAF Video Multi-Method Assessment Fusion [8] or Video Multi-Method Assessment Fusion [8] is a metric for evaluation of the perceived quality of an image. Published in 2016, it combines several different metrics that estimate accuracy of visual information, additive distortions and motion. VMAF algorithm was developed using machine learning model. Several models have been produced with a focus on different resolutions and the distance to the object (for example, when analyzing images encoded for mobile phones) including a separate “VMAF phone” model.
VMAF shows research-proven high correlation between the metric and the human perception of the image. However, the metric calculation is quite resource-consuming process. The VMAF calculation time can exceed the PSNR calculation time by 6–12 times.
| Video quality | VMAF values |
| Excellent | 90 or more |
| Good | 74-90 |
| Fair | 58-74 |
| Poor | 38-58 |
| Bad | 38 or less |
VQM is a measure of video distortion effects. The metric is quite controversial regarding the correlation with the subjective ratings given by viewers. The algorithm performs operations on the DCT cosine transform coefficients. The value 0 corresponds to complete identity of the video sequences and the highest video quality. The higher the value of the metric, the greater is the difference and the worse is the quality.
| Video quality | VQM values |
| Excellent | 0-1,23 |
| Good | 1,23-1,74 |
| Fair | 1,74-2,3 |
| Poor | 2,33-3,03 |
| Bad | 3,03 or less |
DELTA - The metric value reflects the differences in the chroma components. The metric is used to test codecs and filters. DELTA is less representative for quality evaluation, and it better suits the purpose of detecting difference in brightness. For 8-bit video sequences, the values range from -255 to 255, while the higher the metric value, the greater the difference. The value 0 corresponds to complete identity of the video sequences.
| Video quality | DELTA values |
| Excellent | 0 - 0,144 |
| Good | 0,144 - 0,236 |
| Fair | 0,236 - 0,3 |
| Poor | 0,3 - 0,369 |
| Bad | 0,369 or less |
MSAD is calculated the same way as DELTA, with one exception, namely the difference being an absolute value (modulus). The value 0 corresponds to complete identity of the video sequences, while the maximum difference corresponds to the value 255 for 8-bit video sequences.
| Video quality | MSAD values |
| Excellent | 0 - 2,05 |
| Good | 2,05 - 2,67 |
| Fair | 2,67 - 3,22 |
| Poor | 3,22 - 3,96 |
| Bad | 3,96 or more |
MSE is the simplest metric that measures the average difference between the estimated values and actual value (mean squared error). The value 0 means that video sequences are completely identical, while the maximum difference corresponds to the value 65025 for 8-bit color depth.
| Video quality | MSE values |
| Excellent | 0 - 15,5 |
| Good | 15,5 - 28,9 |
| Fair | 28,9 - 47,7 |
| Poor | 47,7 - 83,2 |
| Bad | 83,2 or more |
NQI is a metric designed to evaluate video quality by combining three components: correlation loss, luminance and contrast distortion. The value range is 0 to 1. The lower the value, the worse the quality.
| Video quality | NQI values |
| Excellent | 0,43 or more |
| Good | 0,33 - 0,43 |
| Fair | 0,28 - 0,33 |
| Poor | 0,21 - 0,28 |
| Bad | 0 - 0,21 |
Conclusion
It should be noted that there is no single universally applicable objective metric suitable for solving all possible video quality estimation challenges. The effectiveness of any metric and its correlation with a user's perception of quality depends on the dynamics of the video content, the complexity of the scene compressed, and the quality of the reference video sequence. The study materials were selected in such a manner to ensure that the interpretation of the metric values matches the quality of different versions of video streams.
All those metrics can be calculated using tools included into Elecard StreamEye Studio.
References
- ITU-R BT.500-14 (10/2019) Recommendation. Techniques for the subjective assessment of TV image quality https://www.itu.int/dms_pubrec/itu-r/rec/bt/R-REC-BT.500-14-201910-I!!PDF-R.pdf
- Xiph.org Video Test Media https://media.xiph.org/video/derf/
- Ultra Video Group Dataset http://ultravideo.fi/#testsequences
- Elecard StreamEye Studio — A set of applications for professional video quality analysis and error detection in an encoded stream to further optimize video compression and verify compliance with standards.
- Elecard Video Quality Estimator — Professional application for video quality analysis using objective metrics
- Janusz Klink, Tadeus Uhl “Video Quality Assessment: Some Remarks on Selected Objective Metrics” https://ieeexplore.ieee.org/document/9238303
- Zhou Wang, Alan Conrad Bovik, Hamid Rahim Sheikh, Eero P. Simoncelli “Image Quality Assessment: From Error Visibility to Structural Similarity” IEEE transactions on image processing, vol. 13, no. 4, april 2004
- Toward A Practical Perceptual Video Quality Metric, Netflix Technology Blog https://netflixtechblog.com/toward-a-practical-perceptual-video-quality-metric-653f208b9652
 Author
Alexander Kruglov
Alexander Kruglov is a leading engineer at Elecard. He has been working in video analysis since 2018. Alexander is in charge of support of the Elecard's largest clients, such as Netflix, Cisco, Walt Disney Studios, etc.