June 14, 2023
Transport stream (TS) is the prevailing media data streaming format in IPTV, DVB/ATSC, and OTT digital TV networks. To generate and playback transport streams, the PTS, DTS, PCR timestamps are utilized. Timestamp validation secures streams from asynchrony between video, audio and other media data. The article focuses on the TS generation process, gives a detailed description of timestamps and methodology of timestamp validation, and includes instructions and screenshots on using a tool that assists with transport stream analysis.
I Multiplexing, or generating a TS
The process can be described as follows.
1. A sequence of compressed video frames, audio samples, closed captions, and teletext pages is encapsulated into PES (Packetized Elementary Stream) packets.
- PES packets have a variable length that depends on the unit size of the encapsulated data.
- Each PES packet has at least one timestamp, a PTS (Presentation Time Stamp) and possibly a DTS (Decoding Time Stamp).
- The PTS indicates the point in time when the corresponding elementary stream (ES), such as a video frame, audio sample, teletext page, or closed caption, should be played back.
- The DTS (Decoding Time Stamp) indicates the point in time when the video frame should be decoded.
- The DTS is specified if its value is different from the PTS.
2. Each PES, in turn, is fragmented into TS (transport stream) packets of a fixed size, 188 bytes1.
- If PTS and DTS are time values, there must be a continuous timescale (clock) that contains these values. Such a timescale is formed by PCR (Program Clock Reference) timestamps. They are specified in TS packet headers.
3. Overhead data is also added to the stream, including PSI/SI (Program Specific Information/System Information) tables, SCTE-35, and other data transmitted as part of the TS. Thus, a Transport Stream is a sequence of TS packets (Fig. 1).
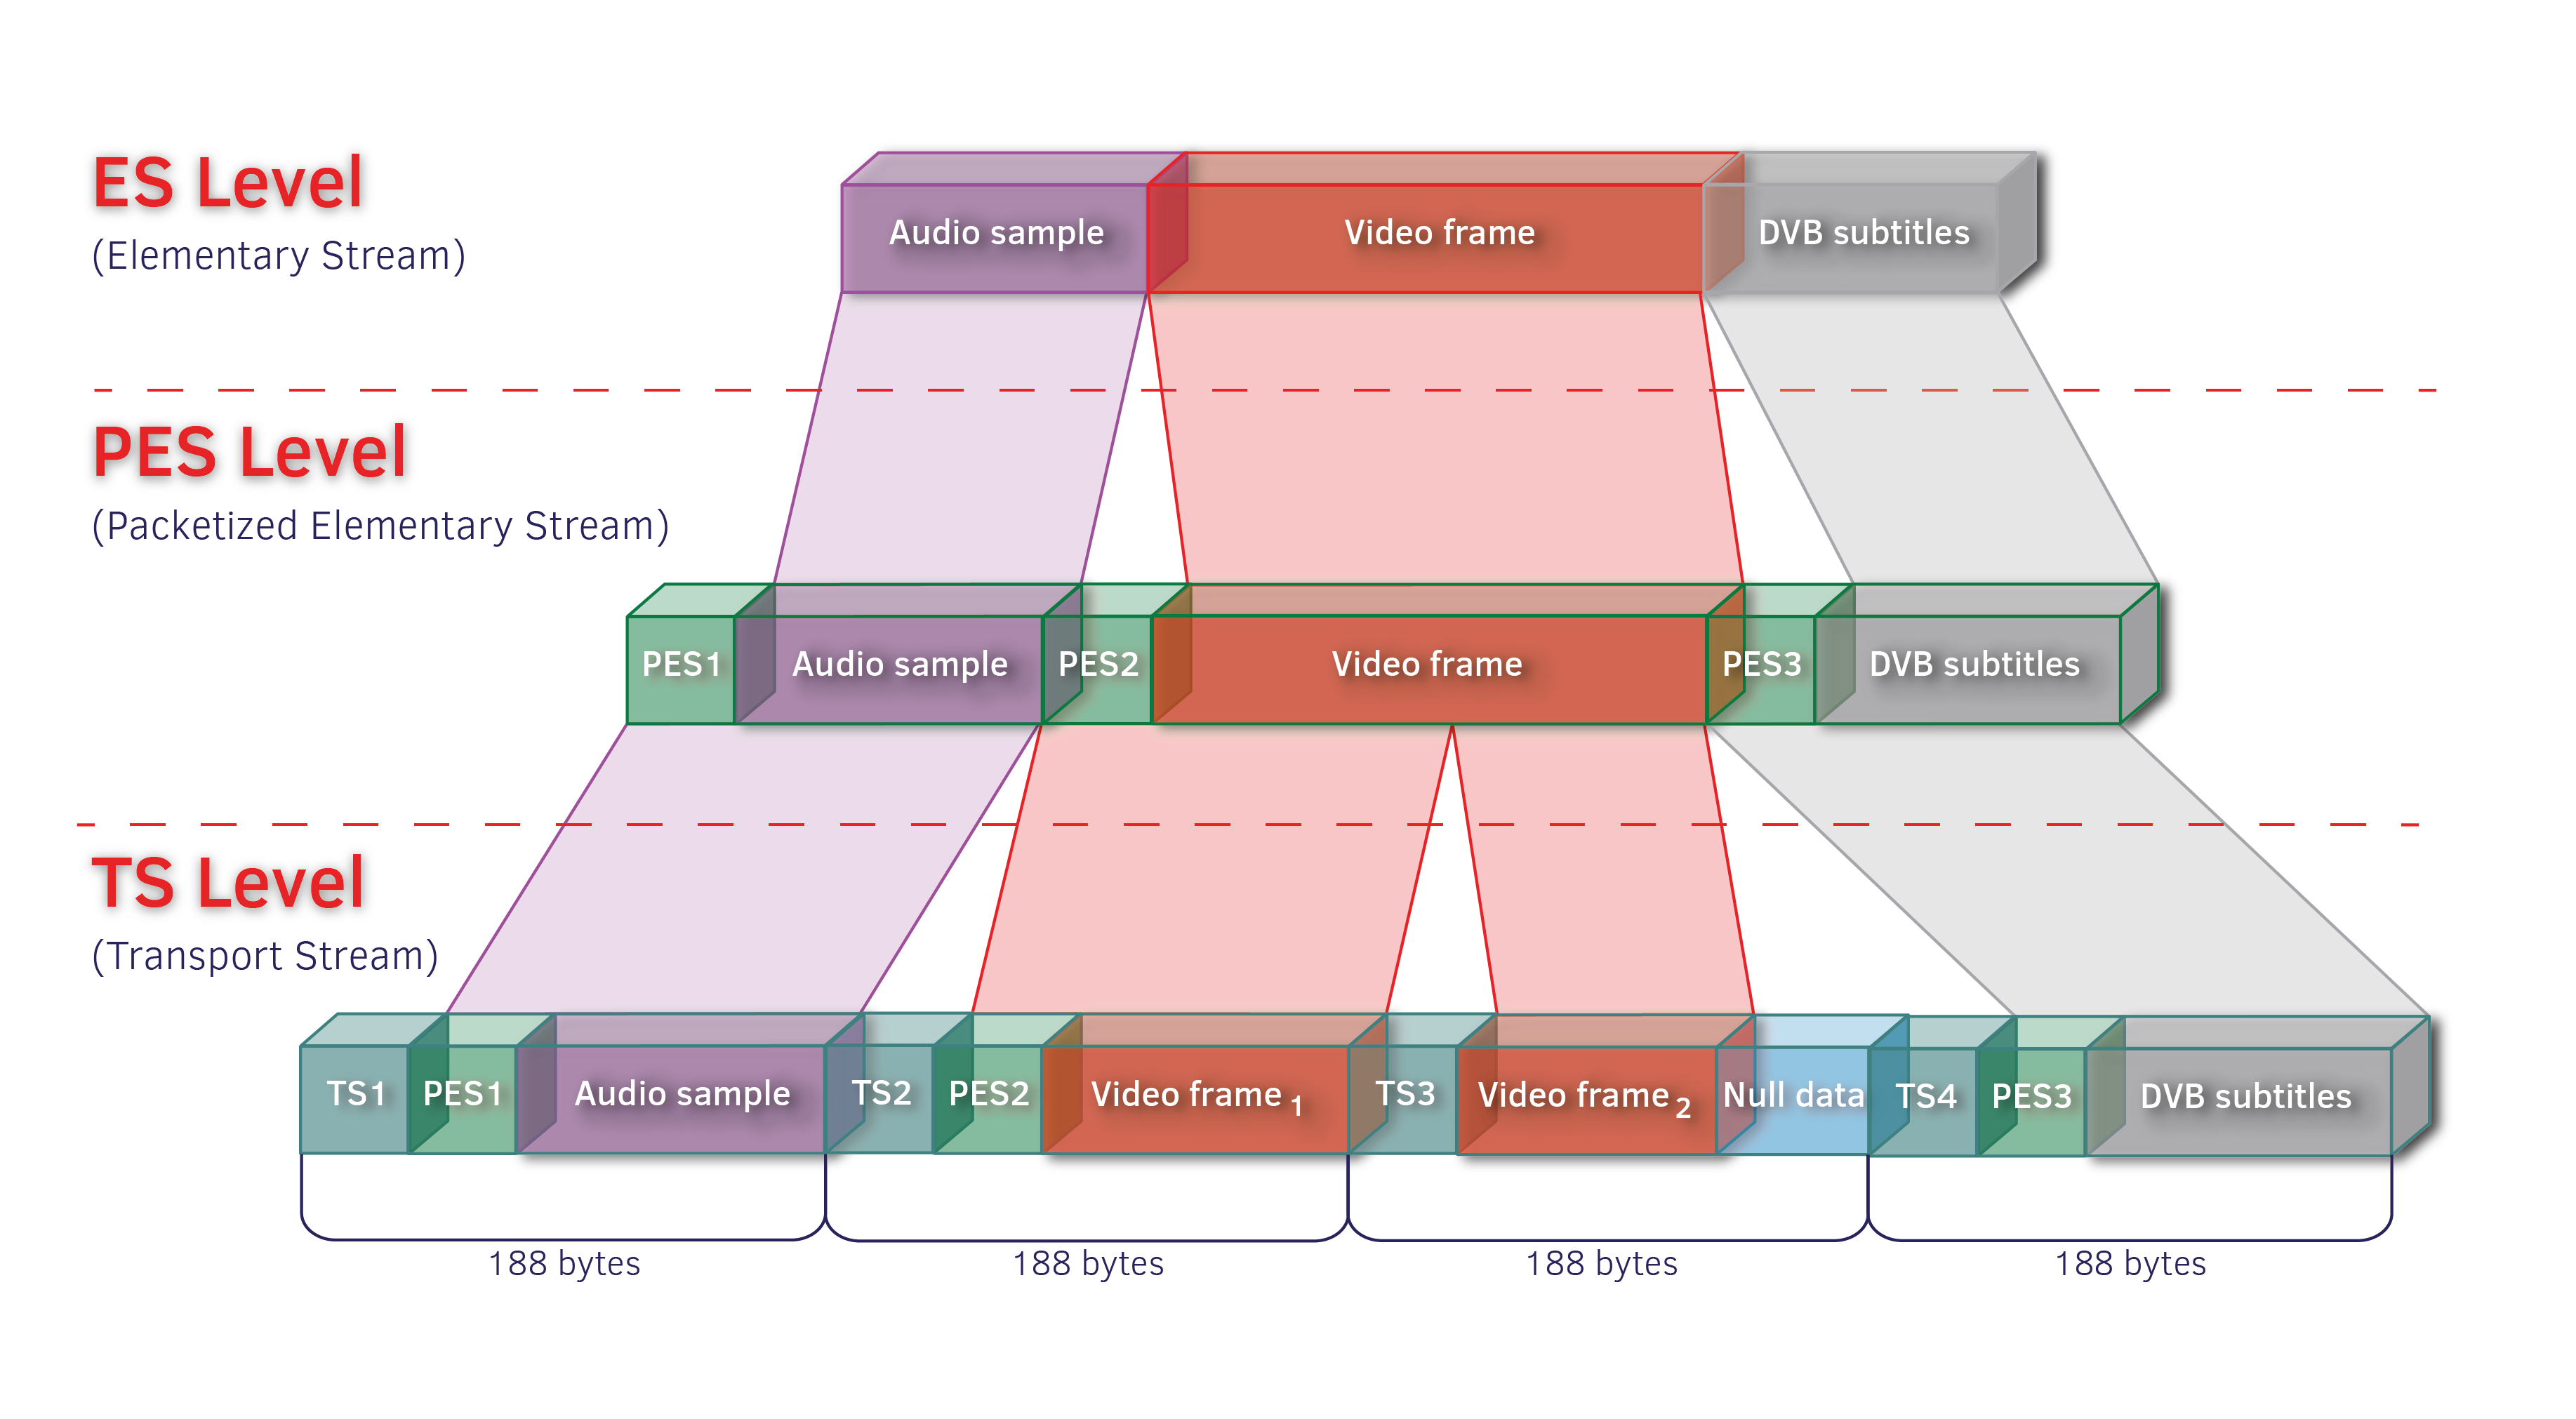
Fig. 1 – Structure of a Transport Stream
Multiplexers, DVB/ATSC modulators, and OTT packetizers use PTS to synchronize video, audio, and other types of ES. PCR stamps are used for synchronizing the clock between the transmitter and receiver sides.
Erroneous or inaccurate timestamps will cause loss of synchronization, delays, and broadcast and playback issues.
Timestamp validation is therefore critical for providing high-quality experience. This article focuses on detailed analysis of timestamp validation methodology.
II Validating TS against ETSI TR 101-290
This is a technical specification for the DVB digital TV standard. The standard defines three priorities; timestamp errors are assigned the second priority.
The article will explore the errors covered by this standard. A similar specification exists for ATCS. Its approach to timestamp validation differs in that ATCS has more than one threshold value for each error, with the base threshold values identical to those of ETSI TR 101-290. The same approach is employed for validating TS in IPTV and OTT networks.
To analyze a captured stream, Elecard Stream Analyzer is used. The application verifies the stream and displays the errors it detects in a TR 101-290 window. Stream Analyzer helps to ensure the captured stream doesn't contain the following errors (Fig. 2):
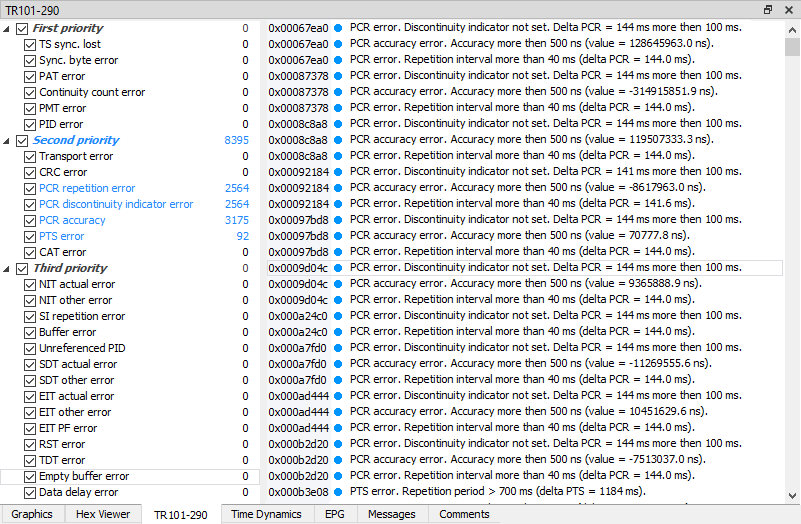
Fig. 2 – ETSI TR 101-290 errors
PCR Repetition error: detected when the delta between two consecutive PCR values exceeds 40 ms. This error was removed from the specification because experts decided that a threshold value of 40 ms was too strict a requirement and exceeding it did not cause noticeable problems.
PCR discontinuity indicator error: detected when the delta between two consecutive PCR values exceeds 100 ms.
PCR accuracy: indicates PCR positioning accuracy in the selected program via the difference between the expected and actual PCR values. When this difference exceeds a threshold of 500 ns, an error is detected. The more accurate the PCR positioning, the smoother the broadcast.
PTS error: occurs when the PTS timestamp repetition period exceeds 700 ms2.
Consider a video stream with a frame rate of 25, meaning 25 frames are displayed per second. At this rate, the display duration of one frame, or the delta between two consecutive PTS timestamps, is 40 ms. In accordance with the specification, an error is detected when the PTS delta exceeds 700 ms. Although deltas of 41 ms to 700 ms are not considered errors, such prolonged timings indicate absence of data – or, in other words, broadcast gaps.
An ETSI TR 101-290 validation is sufficient in most cases but not complete, therefore we proceed to a second stage.
III Visual analysis of timestamp dynamics
Stream Analyzer can display a plot of any integer parameter. To generate a PTS or DTS plot, set the PES checkbox next to the stream of interest in the Explorer window. A list of PES packets is displayed in the central window. Select any packet, then right-click the PTS value in the Property window and choose Add to graphic control. A plot appears in the Graphics window. The steps for generating a PCR plot are similar, but unlike PTS/DTS, PCR timestamps are stored in TS packets.
PTS and DTS have 90 kHz resolution. The maximum value is 233 – 1, after which a rollover occurs. The values should monotonically increase with each consecutive PES packet. This is true for video frames in a display sequence.
In the process of compression, the encoder can reorder frames and create two sequences:
- a stream sequence, in which the frames were compressed and packed into a stream;
- a display sequence, in which the frames are presented.
Similar to PTS/DTS, PCR values should monotonically increase.
A reference timestamp dynamics plot looks like a straight line (Fig. 3).
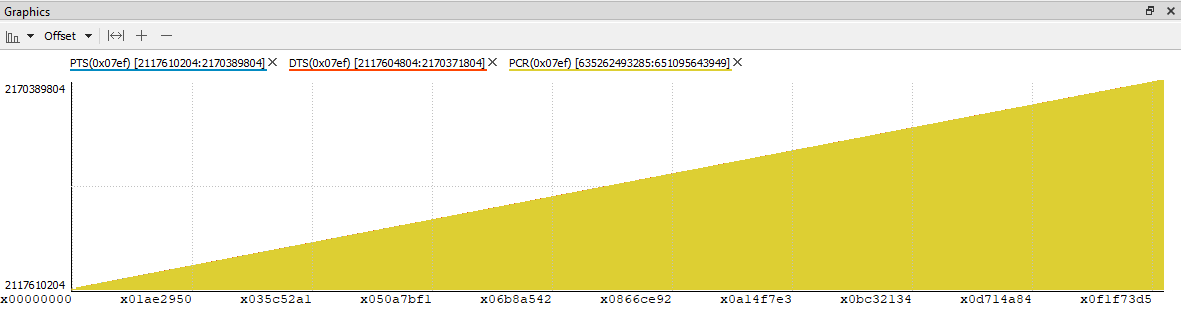
Fig. 3 – PTS, DTS, and PCR dynamics
Any deviations indicate multiplexing problems, which can be caused by errors in the input stream or incorrect transcoder/multiplexer settings (Fig. 4).
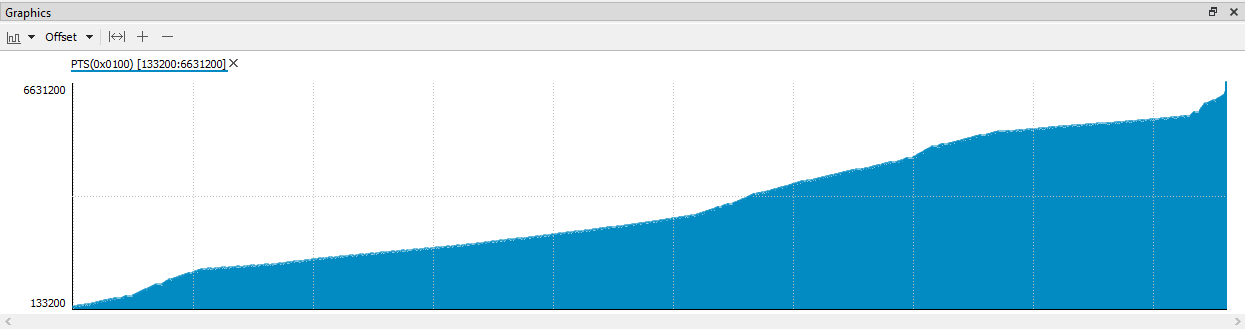
Fig. 4 – Non-uniformly increasing PTS timestamps
Consider the OTT case. The player plays back HLS TS chunks sequentially. Each HLS chunk is generated by fragmenting a single TS into multiple separate files. But OTT is just one type of distribution. Therefore, a plot of several sequentially connected HLS chunks should look like a straight line that increases monotonically, with no discontinuities.
IV The absence of errors with regard to ETSI TR 101-290 and linear timing plots do not guarantee a problem-free stream.
Timestamp sequencing needs to be additionally checked. We use the Time Dynamics tool for that:
1. Open the Time Dynamics window, select the PTS only mode and specify Video PID as Base and Audio PID as the Complementary option. The plot shows that total variation between the Video and Audio timestamps is 3 seconds (Fig. 5).
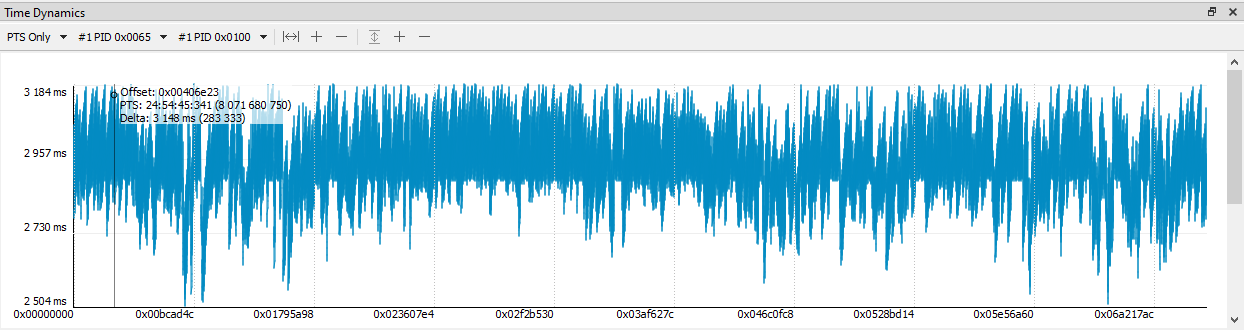
Fig. 5 – Variation of Video/Audio PTS timestamps
The greater the PTS variation, the larger the buffer that is needed for data synchronization. The working range is up to 1 second. Exceeding the threshold can lead to these consequences:
- an additional delay may occur;
- the multiplexer, modulator, or packetizer may be unable to generate a valid TS, which will be evident from a jagged broadcast plot and numerous errors in the log;
- set-top boxes and players may very likely fail to playback the resulting stream correctly, causing a jerky or freezing picture as well as loss of video to audio synchronization.
It is important to note that the plot should not show an upward or downward trend in the delta, because that would indicate a gradual divergence of timestamps, which will definitely lead to the problems mentioned above.
2. Select the PTS only mode, Video PID, and PTS/DTS Dynamics. The plot shows the difference between two consecutive video PTS values. A similar plot can be generated for audio PTS.
This plot visualizes the second-priority PTS error with a threshold of 700 ms (Fig. 6).
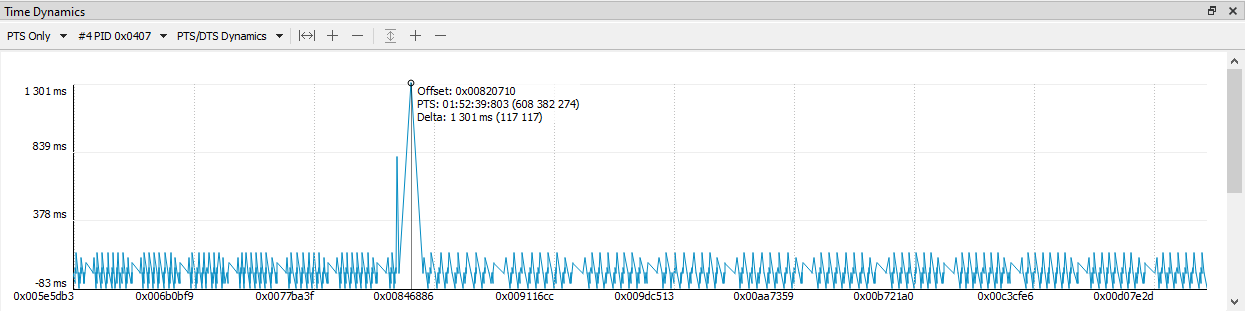
Fig. 6 – PTS timestamp deltas for Video PID
3. Select the PTS/DTS mode, Video PID, and PTS/DTS Dynamics. The plot shows the difference between PTS and DTS. Under normal conditions, the plot looks like a constant, but slight fluctuations in the upper region are possible. An upward or downward trend indicates the spread of timestamps. Negative deltas correspond to the case in which the DTS value is greater than the PTS, it should not be this way. Both options might lead to synchronization loss on the streaming and receiving sides. (Fig. 7).
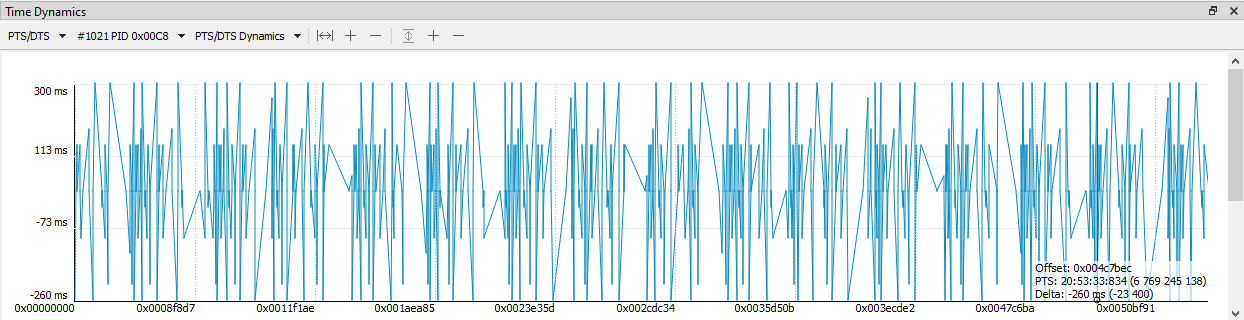
Fig. 7 – PTS/DTS timestamp deltas for Video PID
4. PCR Dynamics shows the delta between two consecutive PCR values. The threshold values are 40 ms and 100 ms. When these are exceeded, the 2nd-priority PCR Repetition error and PCR discontinuity indicator error are detected, respectively (Fig. 8).
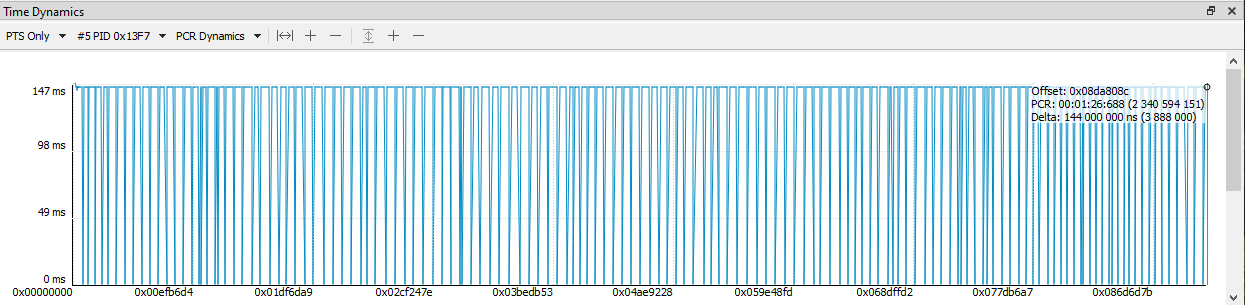
Fig. 8 – PCR timestamp deltas for Video PID
5. Select Video PID or Audio PID and PTS/PCR Dynamics. The plot shows the variation between PTS and PCR timestamps for the same point in time. The working range is up to 1 second. In Fig. 9, the delta is 3 seconds, indicating potential problems discussed in point 1 above.
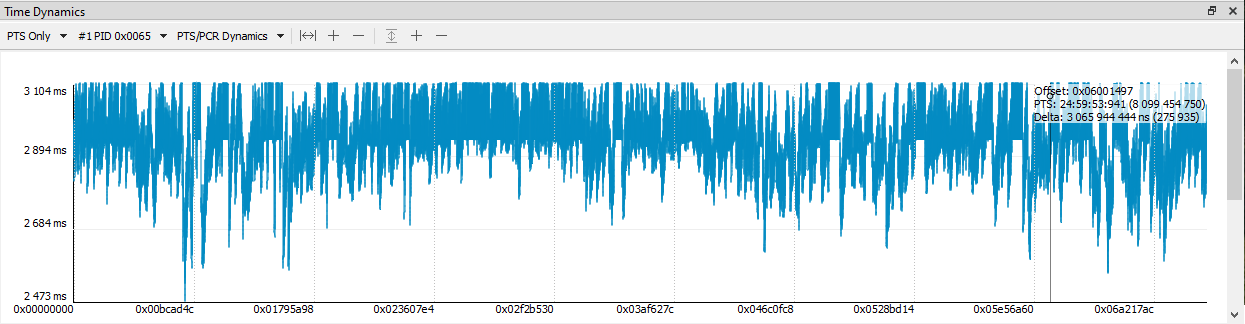
Fig. 9 – PTS/PCR timestamp variation for Video PID
6. The Offset/PCR Dynamics plot shows the deltas between the positions of TS packets containing PCR timestamps and indicates how uniformly PCR values are distributed in the stream (Fig. 10). The plot is normally a constant. In practice, upward and downward fluctuations around a certain average value are possible. However, the plot should not show a distinct upward or downward slope (trend).
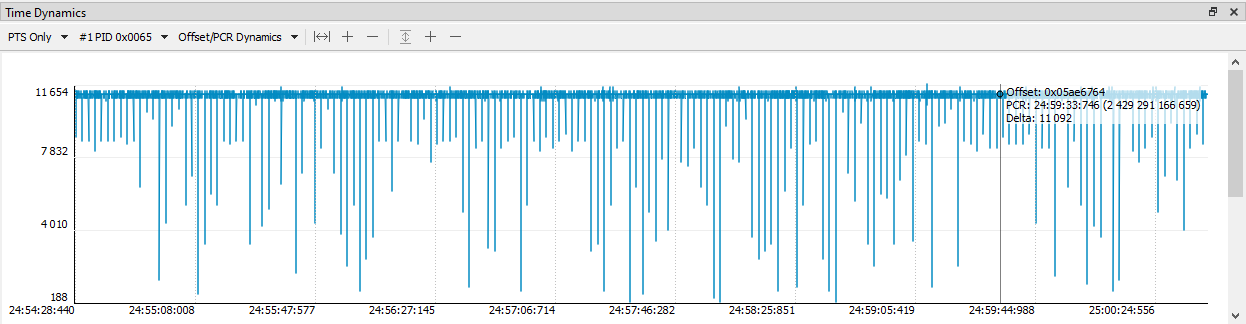
Fig. 10 – Variation of PCR timestamps in the stream
7. PCR Accuracy visualizes the deviation of PCR values from the expected ones for the selected program (Fig. 11). The allowed deviation is ±500 ns, otherwise the second-priority PCR accuracy error is detected. PCR positioning accuracy determines the bitrate of the whole program, therefore DVB/ATSC modulators are extremely sensitive to this error.
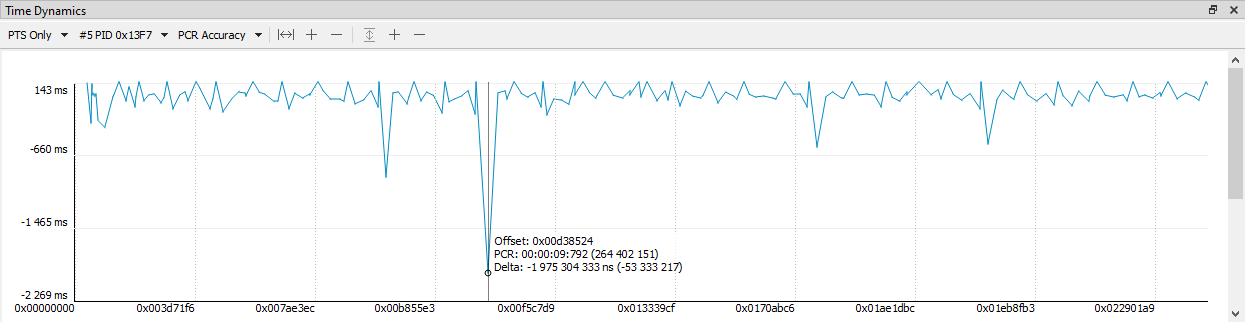
Fig. 11 – PCR accuracy plot
In this guide, we have explored the main aspects of generation of TS, usage of PTS, DTS, PCR timestamps and their validation. This information will assist you at setting up, maintaining, and troubleshooting IPTV, DVB/ATSC, and OTT digital TV networks.
To analyze timestamps in a captured file, you can use the Stream Analyzer tool included in Elecard StreamEye Studio.
1 A possible implementation using Reed–Solomon codes is not considered in this article.
2 The "Still pictures" case is not considered in this article.
 Author
Alexander Kruglov
Alexander Kruglov is a leading engineer at Elecard. He has been working in video analysis since 2018. Alexander is in charge of support of the Elecard's largest clients, such as Netflix, Cisco, Walt Disney Studios, etc.