Disclaimer: At the time of publication, the solution is still under active development and extended testing. Certain technical details may be refined in subsequent releases.
What Is Non-Intrusive Monitoring
Non-intrusive monitoring is a monitoring method in which an existing session between a signal source and a receiver is observed without breaking that session.
In other words, the monitoring probe does not establish a separate session with the source and does not create intermediate sessions, as is the case with relay/proxy solutions.
Advantages
- The probe monitors exactly the same session intended for observation.
- The probe does not create a second session and therefore does not double the traffic or the load on the source.
- No relay/proxy is used, which means no additional latency is introduced, and the probability of failure is not increased.
Disadvantages
- Configuration is required not only for the probe but also for the switching equipment; network engineering expertise is needed.
- Measurements at the receiver may differ from probe measurements. However, this approach is more accurate than creating a separate monitoring session when it comes to QoS.
- Launching monitoring tasks is not straightforward (this will be discussed below).
- Monitoring encrypted streams may be problematic or even impossible.
Nevertheless, the advantages outweigh the disadvantages, and this approach aligns with customer expectations.
What Is a Probe
Boro Probe is a software application that runs on x86-compatible hardware under Windows or Linux. It is typically deployed on a dedicated server. The probe is installed as a system service. The server is equipped with the necessary number of network adapters, each providing sufficient bandwidth to receive the monitored streams.
The application can also be installed directly on encoders, transmitters, receivers, and other equipment, provided the equipment runs on x86-compatible hardware with a Windows or Linux operating system.
Boro Probe receives streams and collects detailed QoS and QoE metrics. Statistics (not the streams themselves) are sent to Boro Server, which is typically deployed on a separate machine. The server provides probe management, visualization of graphs and tables, as well as triggers and alerts configuration.
Methods for Capturing Traffic in Non-Intrusive Monitoring
Technically, non-intrusive monitoring can be implemented in several ways. As mentioned earlier, these approaches must neither create a separate session nor disrupt an already established one.
Network TAP
Network TAP (Test Access Point) is a hardware device installed inline on a network link. It passively copies all traffic in both directions for monitoring, security, or analysis—without disrupting the live data flow. It provides a faithful copy of the traffic, unlike SPAN ports, which may drop packets. TAPs range from simple passive devices inserted inline with the cable to more complex units capable of aggregating multiple ports and providing additional functionality. In all cases, this approach requires installation of additional hardware that is physically inserted into the link, introducing a potential point of failure.
Port Mirroring
Port mirroring, or Switched Port Analyzer (SPAN), is a network traffic monitoring feature that copies packets from one or more source ports to a destination port. A monitoring device connected to that port can then analyze the traffic without disrupting the network. The advantage of this method is that no additional hardware is required, as almost all modern switches support this feature and are typically already present in the network. The disadvantages include potential packet loss on the mirror destination port, which may occur for two reasons:
- The mirror destination port may have lower priority than other ports and will be the first to drop packets under heavy load;
- Mirroring may direct a volume of traffic that exceeds the destination port's bandwidth.
Installing Probe Software Directly on the Signal Source or Receiver
If the source or receiver is software running on an x86-compatible PC under Windows/Linux, then the computer's network stack serves a similar function to a network TAP, providing the probe with direct access to the incoming traffic.
Where to Capture the SRT Signal
The first two methods organize monitoring at intermediate points, while the last method places monitoring at the endpoints.
In multicast scenarios, a probe is typically connected to the nearest switch at the potential multicast receiver location, where it is logical to measure delivery quality (QoS). However, when monitoring a retransmission-capable protocol such as SRT, the probe may also be deployed on the source side or at an intermediate point, since the probe can capture packets containing retransmission requests.
In this case, it is necessary to log two sets of data: the current state at the measurement point and the state accounting for retransmission requests from the receiver.
The Boro Probe application works regardless of which method is used to divert traffic for monitoring. Below, traffic mirroring is used as an example.
How the Probe Works with SPAN-Captured Traffic
In the diagram below, monitoring is performed at an intermediate point close to the receiver. A server running the probe is connected to the same switch as the SRT receiver.
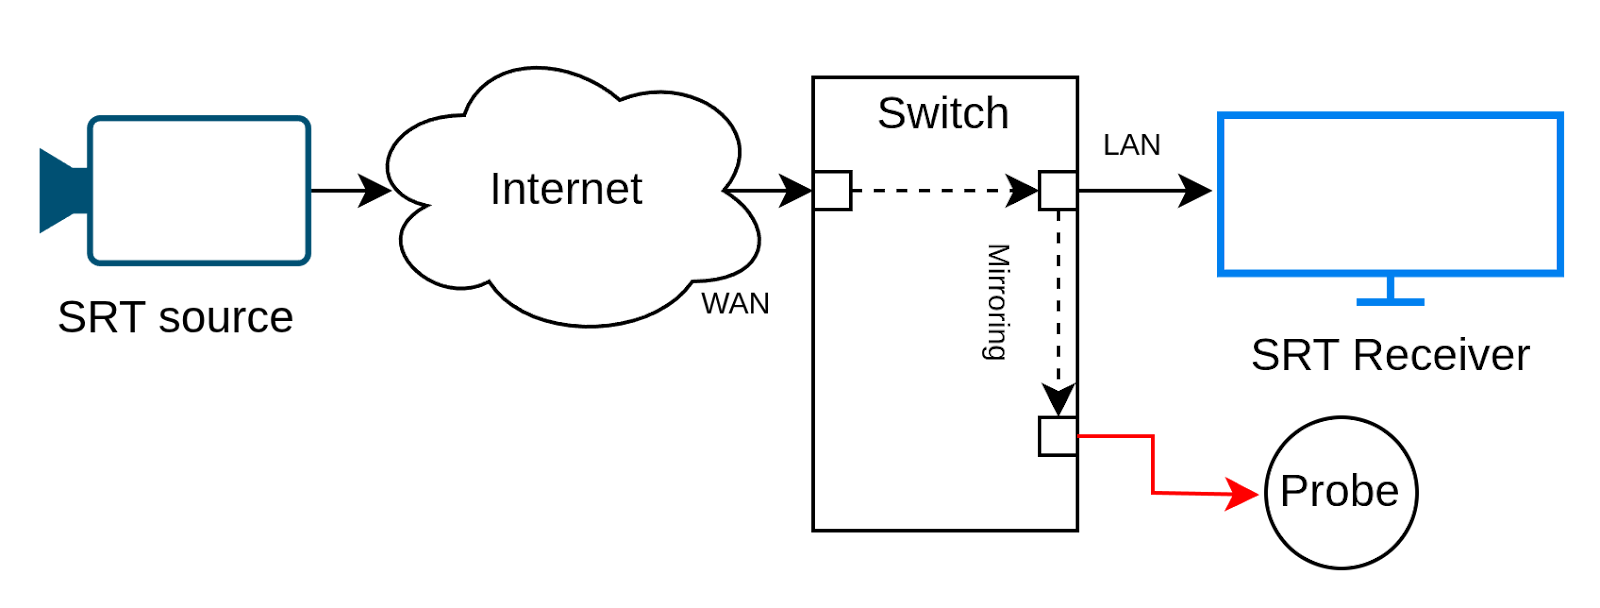
Diagram of SRT-session monitoring via SPAN
The switching equipment must support Port Mirroring (SPAN). This feature duplicates all traffic arriving at the receiver's port and forwards a copy to the port connected to the probe. When configuring mirroring, both incoming and outgoing traffic must be mirrored, since SRT protocol is bidirectional.
When the probe runs on a separate server—as in this example—it cannot receive mirrored traffic through the standard way. Mirrored packets are addressed to other hosts and cannot be received through standard sockets (the conventional API for network communication). Normally, such packets are dropped by network card filters or by the operating system's network stack.
Therefore, when capturing traffic, the probe must switch the network adapter to promiscuous mode. In this mode, the adapter receives all traffic arriving at the port, not only traffic destined for that machine. Additionally, the probe uses the PCAP (Packet Capture API) library, which allows traffic to be captured before it passes through the operating system's network filters. PCAP provides a wide range of filtering capabilities that allow the desired SRT session to be isolated and forwarded it for further analysis.
Launching Monitoring Tasks on the Probe
The task-launching system is designed to be flexible, since monitoring via packet capture is a non-trivial process.
The user may specify either all parameters — srcIP:port + dstIP:port (a 4-tuple), or partial parameters — srcIP:port or dstIP:port. The port is mandatory. Additionally, the protocol type of the captured stream is specified, which in this case is SRT.
The current implementation has been tested with connections in Caller–Listener mode, which means that at least one IP address is always known. A single SRT session always corresponds to a single connection—that is, a fixed 4-tuple. All data—handshake, command exchange, packet retransmission requests, and payload delivery — occurs within the same connection.
Example 1
The probe is located near a receiver running in Caller mode, and the session between peers is already established. In this case, the source IP address, the source port and the receiver's IP address are known, but the receiver's port is not. By specifying the known parameters, the user can start a task that reliably isolates the required session, even if another Caller-mode session is running on the receiver.
Example 2
The probe is located near a receiver running in Listener mode. No caller has connected yet, so only the receiver IP and port are known. When starting the task, only the dstIP:port pair is specified. The probe creates a master task that monitors all traffic on the specified IP and port. As soon as the first Caller connects, the master task captures packets. If the protocol is identified as SRT, it automatically creates a subtask for analysis, passing the first captured packets to it. This allows preservation of Handshake control packets. A new subtask is created for each subsequent Caller.
SRT Monitoring
The SRT protocol is well suited for sniffing in Boro for several reasons:
- It has a small number of well-defined commands,
- Encryption applies only to data packets,
- Perfect forward secrecy algorithms are not used for session key exchange,
- Communication occurs within a single port,
- Data is transmitted in MPEG-TS format.
Once captured, only packets belonging to the target session are passed to the monitoring task, where they are parsed according to the SRT specification.
Like an SRT receiver, the probe maintains a buffer that accumulates received packets. If the analyzer detects a retransmitted packet, this event is logged. Retransmitted packets are inserted into the buffer if the corresponding slot has not yet been evicted. This process produces a reconstructed data stream.
The reconstructed transport stream is then passed to the same pipeline used for regular multicast streams: IAT is measured, stream integrity is verified, TR 101 290 parameters are analyzed, and so on, up to QoE checks.
The probe also logs a set of metrics identical to those of standard SRT monitoring, including Estimated Bandwidth and RTT measurements (based on captured ACK packets).
How to Determine That a Filtered Stream Is SRT
Even if the SRT stream is encrypted, SRT packet headers remain unencrypted. The probe looks for a presumed SRT header and then checks the Socket ID field, which should remain constant across packets. Then the probe examines counter fields that are expected to increase. Together, these criteria allow the probe to identify SRT packets with a high degree of confidence.
Encrypted SRT
To decrypt a stream, the probe needs a few things in place. First, the correct encryption passphrase must be specified in the analysis task. Second, the analysis task must be started before the peers establish the session.
In Caller–Listener mode, the Caller initiates the session by sending handshake control packets to exchange configuration parameters. If encryption is enabled, handshake control packets contain Key Material Messages used to exchange information required for encryption and decryption. By intercepting the handshake packets, the probe obtains the necessary information to decrypt the stream: keys, vectors, and password.
Peers periodically rotate encryption keys, which the probe also captures and applies at the appropriate time.
If a capture task is started for an already established session, the probe has no way to obtain the keys. In this case, only the incoming bitrate will be displayed in the monitoring task, without further detail. This situation will persist until the next Key Material update, which typically occurs infrequently.
Encryption is one of the main limitations of non-intrusive monitoring, but as shown above, it can be handled. The correct sequence of process startup must be followed.
The Problem of Multiplexed Streams
The SRT protocol supports multiplexed streams. Multiple SRT sockets may share the same UDP socket so that the packets received to this UDP socket will be correctly dispatched to those SRT sockets they are currently destined for. During the handshake, the parties exchange their SRT Socket IDs. These IDs are then used in the Destination SRT Socket ID field of every control and data packet.
For example, a session carries a multiplex of two streams. The probe will capture packets with four identifiers: two for data and two for control. Without capturing Handshake control packets, it is impossible to determine which identifiers belong to which stream. This problem also affects RTT and Estimated Bandwidth measurements, since the probe tracks measurement packets that also contain Socket IDs.
As with encrypted streams, monitoring multiplexed streams requires that the monitoring task be started before the SRT session is established.
Buffer Size
Buffer size is a critical parameter when analyzing SRT via sniffing. The probe's buffer size must match the buffer size negotiated between the source and the receiver. Only in this case will packet recovery behavior in the monitoring task be identical to that of the receiver.
During peer negotiation, the largest buffer size is agreed upon and transmitted in Handshake control packets. The probe uses this negotiated buffer size. However, if the probe fails to capture Handshake control packets, the user must manually enter the buffer size in the task creation form before starting the task.
Monitoring Parameters
Below is a list of SRT-specific metrics collected via non-intrusive monitoring.
Calculated by the analyzer:
- Maximum Inter-packet Arrival Time (IAT) for data packets
- SRT Packet Loss
- SRT Packet Drop (measured on the monitoring task side; may differ from receiver statistics)
- SRT Packet Receive
- SRT Packet Retransmit
- SRT Retransmit Rate
- SRT Bitrate
- SRT RcvBuf
- SRT Latency
Extracted from captured ACK packets:
- SRT Bandwidth
- SRT Smoothed Round-Trip Time (SRTT)
Extracted from captured NAK packets (in addition to probe-side calculations):
- SRT Packet Loss
Codebase
Non-intrusive monitoring provides significant advantages over other monitoring methods, but it also requires substantial development effort.
We could not take the existing libsrt library and modify it, because it is based on a standard that assumes sequential data exchange both during handshake and during data transmission from source to receiver. Socket-based operation is architecturally embedded in the library.
In contrast, the probe in sniffer mode does not send any data. It does not interfere with packet exchange and performs only traffic filtering to extract data belonging to a specific session. The probe then parses packets into commands and data according to the SRT standard and reconstructs the received stream in the same manner as a receiver.
As a result, the reception library was almost entirely written by the Elecard team, reusing only a small set of libsrt utility functions (roughly 7–10 % of the codebase).
We do not deviate from, extend, or modify the SRT standard, since the probe does not send a single packet into the monitored session and uses an unmodified libsrt library.
Performance
At the time of writing, large-scale performance tests have not yet been conducted. However, the packet capture subsystem has been in production long enough to expose several performance-related challenges.
The PCAP process runs on a single CPU core and can handle up to approximately 2 Gbit/s of incoming traffic. In the latest probe release, an intelligent algorithm was added that can create multiple processes so that capture does not become a bottleneck.
The PCAP process is responsible only for selecting packets belonging to a specific session; the data is then passed to other processes.
At this stage, sniffing-based analysis can be considered comparable in performance to classical SRT analysis.
The most resource-intensive components are always video decoding and advanced QoE analysis, which are orders of magnitude more computationally expensive than data reception. Video decoding is identical across all monitoring approaches.
Conclusions
Non-intrusive monitoring of the SRT protocol is a highly effective solution that addresses a long-standing industry need. Despite certain limitations and greater configuration complexity compared to standard method, its advantages outweigh the drawbacks. As research has shown, this approach allows collection of all signal metrics that are available in classical SRT monitoring.
One additional important factor should be emphasized: the cost of non-intrusive monitoring is practically identical to that of conventional approach, since it does not require increased probe hardware performance. Since the required switching equipment is almost always already present in production environments, it does not add to the deployment cost.
 | Author: Anton Proshutya — Elecard Boro product manager. He has been working in video quality control since 2007. |
Elecard Boro — software solution for UDP, RTP, HTTP, HLS, DASH, SRT and RTMP streams quality control and measurement of QoS and QoE parameters in all segments of distributed networks. Live stream monitoring.